How to draw support and resistance zones? What is crypto support and resistance? Crypto support and resistance are undoubtedly two of the most critical features of price action analysis.
It may be easy to explain these levels at first, but as you will see, support and resistance trading strategy come in many forms, and it is more challenging to master this concept than it seems.
Crypto support and resistance levels help us find out pivot points so that we can predict the future. The continuation of the trend depends on these areas.
Price will respond to these levels. Using price action patterns and other principles of technical analysis, traders recognize the continuation of the trend.
If traders make a mistake in their analysis, their stop loss will be activated, but if they diagnose correctly, they can make a significant profit.
What is the support level in crypto?
A support level is a price range that the volume of buyers is more than sellers. Therefore, we will see an increase in prices.
Sometimes, after a cryptocurrency price reduction, it will be attractive to traders. In this case, traders wait until the end of the descending trend.
When the price reaches these levels, they open a buy position. As a result, we will see a pump in cryptocurrency. In the figure below, you can see the bitcoin price in a 4-hour timeframe :
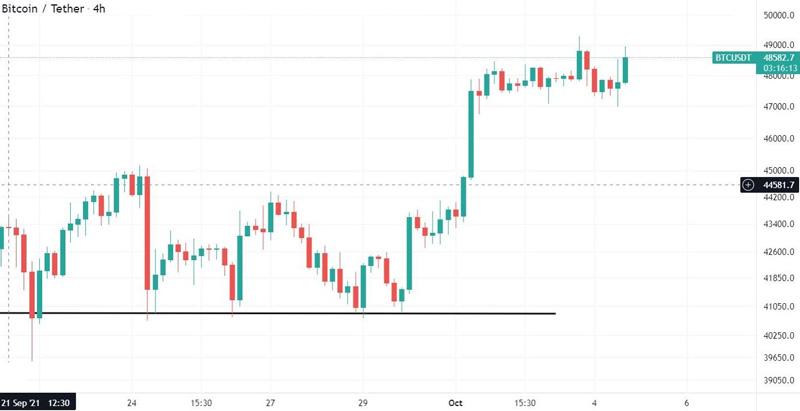
As you can see, $41,000 is a support level for Bitcoin. After the fifth rejection of this level, the price reached $48,582 with an increase of 18%. Highest and best crypto apy staking platform.
Support levels and behavior characteristics
Traders are optimistic about the future and do not want to sell their currency at this price. Every time the price reaches this level, buyers enter the transaction and prevent price dump. The more times price hits this level, the more power it has.
What is the resistance level in crypto?
This is the opposite of the previous case. With the increase in the price of a currency, many buyers are reluctant to open a buy position.
Other traders, having open positions, consider their exit points to be the resistance range ahead.
When the currency reaches its price target, a large amount of the desired currency is sold, and finally, with the increase in the number of sellers relative to buyers, we will see a price dump.
The following figure shows the Ethereum price in 30 minutes time frame:

The price dumped after it could not break its resistance. The above tips are also valid for this case.
Types of crypto support and resistance
dynamic and static support and resistance, are two essential levels we must always pay attention to.
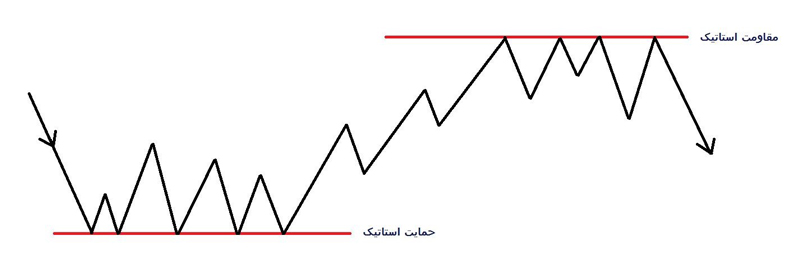
Static crypto support and resistance
As the name implies, these levels are always constant, and their value does not change over time.
For example, $30,000 for Bitcoin is a static or fixed support, and every time the price reaches that area, traders open a buy position, or $53,000 is a fixed resistance for Bitcoin, and as time passes, it does not change.
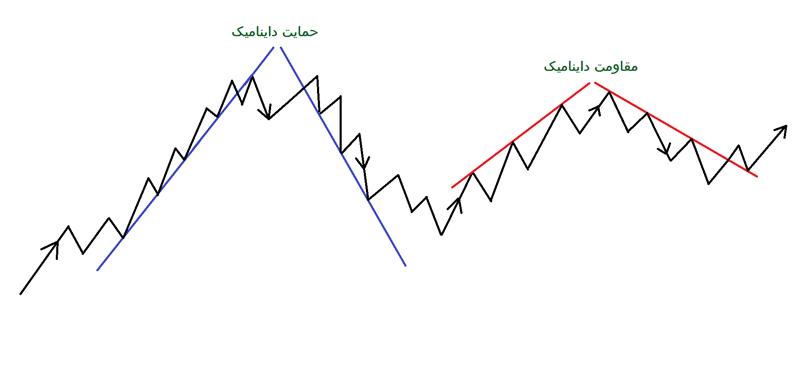
Dynamic support and resistance
It is the opposite of the previous case, these levels are not fixed and change over time.
Each time the price hits that line in an uptrend or downtrend, the price of these levels changes. In another word, these levels are moving.
How to draw support and resistance zones?
We must first find the area that has had the most contact with the chart. Static surfaces are always horizontal lines, but we must draw trend lines to draw dynamic levels.
Trend lines
As the name implies, these lines are drawn in the direction of the trend, and the price reacts every time the chart hits it. They have two types of ascending and descending trend lines. Best free crypto price alert apps.
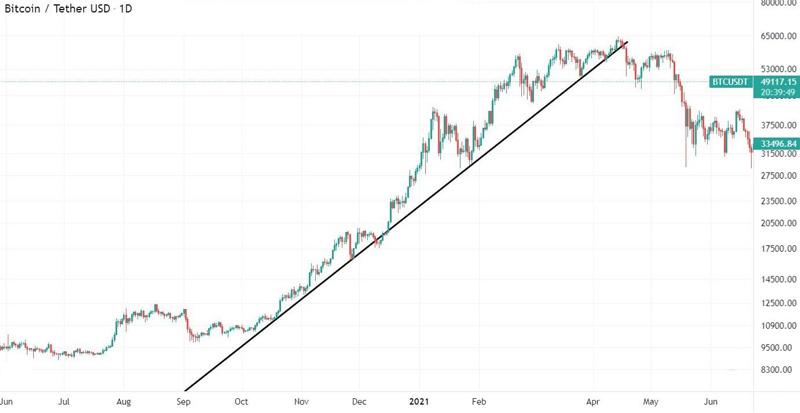
Ascending trend line
Each time the price hits the trend line, the chart moves upwards. Finally breaking the uptrend line at $60,000, bitcoin had a price correction.
In the downtrend line, which is the opposite of the previous situation, we have a price decrease, so the chart continues to move downwards every time it hits the line.
Aave’s price has broken out of the downtrend line. After a pullback to the line, it has experienced price growth.
Crypto support and resistance reversal pattern
None of these surfaces are permanently stable and can break after a while. When the chart breaks the resistance ahead, that level becomes a support level, and from then on, as the price approaches that area, traders open a buy position and vice versa.
After several tries with 0.029 resistance, the cost price could finally break this level. Afterward, this area became a support level.
Stop loss and make profit
what is stop loss
Stop loss in crypto trading is one of the most critical topics of crypto support and resistance that should always be considered. Determining stop loss in futures is much more critical than spot.
To determine the stop loss, you must always specify the support and resistance levels. Suppose you open a buy position on the support level, according to other factors.
In that case, you must place your loss limit below that level and at the bottom of the longest shadow.
If the price reaches that area, it is a downtrend, and your position will be closed with a slight loss. We use the same technique for crypto support and resistance.
Bitcoin mining pool comparison
Take profit in crypto
How to draw support and resistance zones? Just as it is necessary to set a price for the stop loss to avoid further losses, you should know the target of your trade and the exit point before entering the trade.
Take profit indicates the target of your analysis. To determine this, we still need to identify sensitive levels.
In the above figure, you can see the uni swap price. According to these levels, we can open our position. After the price hits the 25-dollar support level, we open a buy position with the specified stop loss shown on the chart.
Despite the price correction, our position is still open, and finally, we close it with a 21 % profit in the resistance level.